
We recently had a big discussion on intelligence in “San Francisco and Schooling” and (to a lesser extent) “Hypergamy and Male Variability.” But, perhaps you want a quick-and-easy rundown on intelligence that doesn’t require an advanced degree. Here is a short video that does just that:
Here is a quick summary of the most important points:
- Intelligence is real and meaningful.
- IQ is not pseudoscience or discredited in any way. It is the strongest subfield in the social sciences, with over a century of research. While other social sciences suffer from a massive replication crisis (and P-hacking), intelligence research does not.
Irony: Replicability crisis in psych DOESN’T apply to IQ: huge n’s, replicable results. But people hate the message.
- Intelligence (theoretical or potential ability) and Achievement (actual and practical skills) are highly correlated. Knowing one typically allows you to know the other one with a high degree of confidence.
- We don’t need to precisely define intelligence to know what it is or to use it. A single number is, paradoxically, quite useful and predictive.
- Intelligence is not the only factor of a person.
Far and away the biggest problem with intelligence is that it is valid and people don’t like the implication. We are going to see a lot of that.
Sigma Frame recently wrote a piece responding to my article “Church Attendance.” He had some good analysis of the statistics surrounding the changes in Eastern Orthodoxy and American Evangelical Protestantism. I don’t really want to go into the first part of his article. What I want to focus on is what was written about intelligence and correlations:
The end of DLR’s article shows four maps of the U.S.: Divorce Rates, locations of EO churches, the concentration of Southern Baptist (SBC) churches, and IQ of all things.
The maps of Divorce Rates, SBC churches, and low IQ all had high concentrations in the Southern U.S.
DLR didn’t offer much of an explanation of why he included these maps, except to conclude…
- “…a lot of this data on religious observance is statistically confounded.”
- “Evangelical Protestantism in America is not doing so bad compared even to the Orthodox…”
Hey dude! SBC is THE most outstanding Evangelical Protestant church in America, and it is correlated with divorce as shown in DLR’s maps and also by several other metrics (covered by Dalrock). I don’t see how DLR can say “Evangelical Protestantism in America is not doing so bad”. Numbers don’t mean health. Heh. Again, correlations like this are exactly why young men are fleeing AEP for EO.
DLR’s inclusion of IQ among the correlating maps gave me the impression that he is labeling Southern Baptists as Divorced-crazed idiots. He never explicitly said so in writing, but I would agree that this label is truthish. Ask me how I know.
This does not appear to show awareness that this…
…is a complete explanation for:
He doesn’t think that confounding is “much of an explanation.” I can only conclude that this is because the significance of confounding is not understood. I don’t mean to be insulting, but it is a simple fact: the failure to understand statistical confounding leads to an extremely restricted understanding of statistics. It risks preventing one from drawing correct conclusions and leads one to draw incorrect ones instead.
Thus, despite intuiting the correct conclusion…
…he still draws the wrong conclusion by failing to consider the confounding:
To flush these correlations out in more detail…
- Higher rates of divorce correlate with lower IQ.
- Protestant churches have higher divorce rates than Cathodox churches.
- The convergence of SBC with cultural feminism is an unholy union that fosters more divorce.
Furthermore, these correlations provide strong incentives for intelligent young men to leave Protestantism for Cathodoxy.
In failing to address confounding, this mistakes correlation for causation.
Let’s make this simple.
Protestant churches in the SBC have higher divorce rates than Eastern Orthodoxy because the SBC has a significantly lower intelligence population and the Eastern Orthodox have a signficantly higher intelligence population.
The EO faithful are smarter than the SBC faithful, so they get fewer divorces. The EO has such a low divorce rate because it is largely populated by higher IQ people of direct European decent. It has little-to-nothing to do with their theology.
Intelligence—not cultural feminism or theological beliefs—is the causative factor here. The divorce rates among the faithful of the SBC and EO correlate with the divorce rates of their secular peers.
There is no divorce risk incentive for young men to leave Protestantism for Cathodoxy. If young, low IQ men left the SBC for Eastern Orthodoxy, their divorce risk would move with them. This would result in a sizable uptick in the average divorce rates among the EO.
The articles on the growth of Eastern Orthodoxy highlight men with the following surnames:
- Mullins (English/Irish)
- Christenson (Scandinavian)
- Thell (English or Scandinavian)
- Wee Sit (East Asian)
- Porcu (Italian)
- Heimbach (German)
- Leonova (Russian)
These are all from the higher IQ groups—White and Asian—with not a single Hispanic or Black person featured. And that’s just the parishioners. The priests featured follow a similar pattern.
Given that most Eastern Orthodox churches are found in formerly Non-Evangelical Mainstream Christian strongholds, I suspect that Eastern Orthodoxy is the strong beneficiary of a switch by young men who previously attended liberal Protestant churches. After all, a person isn’t an evangelical just because they are politically far right (which seems to be the common thread).
It would be better for highly intelligent Protestants to abandon the SBC for one of the “Baptist-style” non-denominational churches or one of the Evangelical denominations outside of the Bible Belt. The growth rates of these other denominations indicate that this shift is exactly what has been happening.
Now, let’s get back to the topic of intelligence.
Absolutely. Some of these ‘Intelligence Quotient’ questions are subject to multiple interpretations and which answer is correct depends upon which interpretation is deemed valid, i.e. which interpretation is the most popular.
Yet what has actual intelligence to do with popularity?
This is an extremely common type of objection that people make. It’s supposed to throw water on the idea that IQ tests have merit. It’s supposed to lead you to believe that IQ tests are inaccurate and have limited value. But this is far from the truth.
IQ tests do have limitations, but those limitations are extremely overblown by critics and are quite often of little practical significance. We’ll discuss this further below.
IQ is not a test of popularity. Not even close. It’s barely even trivially relevant.
I’d be careful with statements like the one above. IQ testing is administered by imperfect humans, with the fault and bias that can mean, and can have some cultural bias.
On the other hand, those administering the tests tend to follow protocols to counteract potential bias and the questions are designed to be aligned with knowledge the typical person should have given an attained age. The IQ normal curve also holds across cultures indicating the any cultural bias may be minimal when considering IQ.
Take all those limiting factors—popularity, imperfect proctoring, various forms of bias—and realize that these are all well-known effects. As RPA notes, many of them have long since been corrected for through norming practices.
But, for sake of argument, what if they were not? It turns out, it probably wouldn’t actually matter all that much. Why? Because even when you acknowledge all the limitations, IQ scores are still statistically valid and replicable. Their validity is not based on some theoretical best-case, but on the error-prone measurements. Thus, despite all the flaws, IQ is still extremely useful and valid:
Irony: Replicability crisis in psych DOESN’T apply to IQ: huge n’s, replicable results. But people hate the message.
The flaws do not make IQ useless, rather if those flaws were somehow completely fixable, it would only make intelligence even more accurate and useful than it already is. Pointing out flaws doesn’t have an practical benefit, because we already know that IQ is useful even with those flaws. The strength of IQ is true even in the presence of flaws. We are already operating in the worst-case scenario and IQ still works great!
The only response to people who throw shade on IQ is to acknowledge that the conclusions people make are not diminished in any way by those flaws. Rather, the conclusions can only be further strengthened by the removal of those flaws. Whenever you see someone make a claim about IQ, just add the following implicit statement:
To illustrate this, you can take virtually any human flourishing metric and you’ll find the same IQ correlation every single time. It doesn’t matter what population or metric you are using. The correlations will still be there despite the errors present in the data. You can also do this for any test of academic achievement, including non-standardized ones that are riddled with bias or cheating. You can even include weird things like color discrimination, pitch discrimination, and weight discrimination.
This is such a common meme that in the HBD world it is simply called The Map (there are actually two of them).
The signal being measured—intelligence—is so strong that it obliterates the sources of error. It’s something like this:
In fact, bias itself is confounded by intelligence, so a distribution of the measurement of that bias will still be predicted by intelligence!
Critics of IQ will often foolishly blame differences on racism or injustice. They’ll note that a particular test—say a test for air traffic controllers—is biased against blacks. So they’ll alter the test until they get blacks to pass at the same rate that whites passed on the previous test. The problem? Whites now pass the test at a nearly perfect 97% rate. Despite the explicit systemic bias introduced by the critics, the results are still distributed according to intelligence.
The signal is so strong that it is really hard to intentionally design any test that doesn’t have at least a partial, but clearly evident, intelligence correlated distribution.
Even measures that are not supposed to have any correlation with IQ at all may still have some:
| Trait or Construct | Approximate Correlation (r) |
|---|---|
| MBTI – Intuition (N) | 0.20 – 0.30 |
| MBTI – Thinking (T) | 0.10 – 0.20 |
| Big Five – Openness | 0.30 – 0.40 |
| Big Five – Neuroticism | −0.10 – 0.00 |
| Emotional Intelligence (Trait) | 0.10 – 0.20 |
| Emotional Intelligence (Ability) | 0.30 – 0.45 |
(take these numbers with a grain of salt)
Where you should be careful is when you apply intelligence to individuals rather than populations. It is still valid, but it is less predictive due to individual variability. This is why, in the video, Sailer warns against using intelligence as the sole measure of an individual. It’s not wrong to evaluate someone individually, it’s just incomplete. Individual predictions based on intelligence are more error-prone and less confident. This is one reason I speak of probabilistic risk chances rather than saying what will or won’t happen to an individual.
This should be obvious. If you are highly intelligent, you might still divorce. If you are lowly intelligent, you might have a long and happy marriage. These are natural and expected variations. But at the population level, such variations get averaged out. Some groups will always perform better than other groups, even if specific individuals occasionally buck the trend.
While not perfect, IQ measures (there are many that target different aspects of intelligence) tend to be very good predictors of certain metrics especially in academic settings. From there culture takes over where higher IQ people perform better in school, which opens networking and career opportunities and often leads to above average socio-economic standing. Dalrock’s work showing UMC people divorcing at lower rates would seem to fit with the Derek’s charts.
Indeed. Simiarly, IQ explains why, in studies that do not control for IQ, you can find groups of non-Christians that have lower divorce rates than groups of Christians.
What would be very interesting, at least to me, would be to see more granular detail on denominations and divorce. I wonder if the divorce rate amongst the various denomination’s membership follows SES? Could skew towards higher SES of membership be a main predictive factor? If we really wanted to know the job a given denomination is doing with keeping families together, we’d want to see the divorce rates variance from the general population when controlled for SES.
SES (Socioeconomic status) is not really much of an alternative to intelligence. The two already correlate strongly together, but the variability caused by differences in SES is much smaller than the variability attributable to intelligence.
For example, SES does not predict criminality within the whole population (e.g. the richest Blacks commit far more crimes than the poorest Asians), but it does predict the criminality within races. As this shows, SES is only really useful as a predictive measure after you’ve determined the impact of intelligence.
I can say with high confidence that SES is unlikely to be the main predictive factor of divorce compared to intelligence. From my memory of previous studies on divorce and SES, the impact cannot trivially be described by a first- or second-order polynomial. It is too complicated, likely because it is confounded my more impactful variables. SES does have an impact, but it isn’t as straightforward (i.e. linear) as other factors.
Some denominations keep better divorce statistics than others, but this isn’t the kind of thing denominations are incentivized to report. Since the Bible teaches that divorce is wrong, if it started asking people if they are divorced and then doing nothing about it, this would be quite… uncomfortable.
NOTE: I scheduled this post for publication before it was finished. Just in case you read it before I realized the mistake, I have since published updates to finish it off.
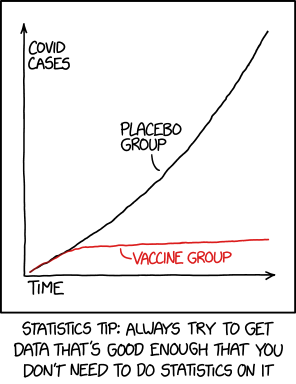
The inclusion of the covid chart is funny. I get that it’s meant to be an illustrative example of an overwhelmingly strong signal. But with the benefit of hindsight and sound statistical thinking, it’s clear that there is NOT actually an overwhelming correlation between Covid vaccination and fewer Covid infections. Graphs like this were based on garbage data from the height of the vaccine push. Terrible case measurement data, huge amounts of false positives, deliberately dishonest parameter setting (vaccinated population considered unvaccinated until a week or two after second shot moved many positive Covid cases aming vaccinated into “unvaccinated” group. Lots of confounding in terms of both who got sick and who got tested. Lots of political and commercial pressure to make exaggerated claims for vaccine efficacy. USG spent Trillions with a “T” on Covid. And the Pfizer and Moderna vaccines EACH set the record for highest first-year revenue of ANY corporate product launch in business history. Bigger than color tv, Volkswagen Beetle, Fedex, iPhone, etc. Now most vaccine proponents grudgingly admit that the vaccine didn’t do much to prevent transmission and wasn’t designed to. The Cleveland Clinic has a few studies of its own large employee base showing that Covid vaccinations correlated with MORE Covid cases.
Anyway, there’s lots of confounding, lots of bad incentives, lots of bad data, etc. A deep dive into the data suggests that the chart you show is fatally flawed. Covid vaccination isn’t correlated with to infection protection to even a tiny fraction of the extent that IQ is correlated to various positive life outcomes.
I think you know all this, but I’m curious about what you think of this comment. Reading a bit about what you’ve written about Covid, it seems that you fully recognize the extent of lie promotion from the captured institutions.
But it also seems like you sometimes fall prey to the temptation that many statistics-savvy people do…to start analyzing the given data even when the given data is suspect. This can be useful… ”based even on their suspect data, their conclusions make no sense,” but it can also lead you down a path of doing a lot of analysis using bad inputs.
Anyway, the inclusion of that chart struck me as incongruous and I just wanted to ask about it. For big fans of the Covid vaccine, the chart may help drive home your point about how strong the IQ factor is. But for me, someone already fully aware of how powerful and robust and predictive IQ is, I thought “huh?” How does THIS controversial and (in my opinion) discredited example help make the case?
Charlie,
Hey, you got the joke! Well done. I’ve been posting that comic for years and you are the first to notice.
This is similar to the guy who posted the “Leopards Eating Faces Party” tweet:
Cavalorn is a leftist who blocks people who use his tweet to point out that this tweet is a self-own. Ask me how I know.
But in both cases, the underlying principle being expressed is correct, even though the specific application (i.e. covid vaccine; leftist policy) is not.
I think you know all this, but I’m curious about what you think of this comment. Reading a bit about what you’ve written about Covid, it seems that you fully recognize the extent of lie promotion from the captured institutions.
I do. I was one of the earliest people who realized that virtually everything covid was based on lies. This is because (1) the data we had did not conform to the narrative; and (2) data fraud was obvious to anyone who was looking for it. There were lies upon lies upon lies. It would take less time to talk about what wasn’t a lie than to list all of the lies.
There were a number of cases where some internet doctor who runs a hospital system would come on Twitter and describe overflowing ER rooms. Now, hospital bed usage data is public record, but the online reporting is typically delayed by a few days or weeks. So doctors can come online, spout any claim they want, and there is no way to perform an immediate fact check.
So I waited. And I did the fact checks. And the doctors were lying. Every single time.
I want to believe that people are basically good. I think most people want this. After all, those doctors have families and loved ones who believe that their loved on is basically good. But what I want is wishful thinking. They lied and they didn’t feel bad about it.
The answer to this is obvious. If you read this blog for very long, you’ll notice that I rather heavily cite what my opponents consider to be facts to prove that what they believe is wrong. By citing what your ideological opponents believe is true, you point out that their beliefs are self-refuting. This works even if the data is suspect.
That’s why I can cite XKCD or Cavalorn in the way that I do.
Throughout 2020 and 2021, I posted a lot about the data fraud on Twitter. I took the data that they tried to manipulate and I showed that even with fraudulent manipulations, their claims were still falsified.
That’s the heart of the XKCD comic: when you make a claim, ensure that the claim is so strong that it is self-evident and valid even in the midst of heavy fraud.
Have you ever noticed that Jesus intentionally allowed people to be misled by his words? People would hear what he said and some would conclude the exact opposite of what he actually meant.
People are rarely convinced by argument, whether good or bad. One’s motivations are usually far more important. Someone who is motivated by truth will have the ability to realize that the graph is wrong…
…but the reasoning is not:
For those without that motivation, it doesn’t matter that the two combined are a self-refuting contradiction. They’ll believe it anyway.
Peace,
DR
I’ve seen statistics bend, converged, and used to defend the preconceived notion of the idea or opinion held.
In college, in a basic “sociology class” this was 1989 the professor was explaining that when the “over ” representation of blacks playing Center in basketball is racist because of overcompensation to that subjected class / group is meant to parade them and put on show for white people”
The statistics proved then that blacks DO play Center in pro basketball more than other groups, but despite this achievement (and playing Center in the NBA isnt just handed to you) its still racist because its meant to somehow deman them.
At IBM in failure analysis, we had serious contamination on our MR slider heads in the FAB process in San Jose. Our sister facility in Japan had an almost ZERO failure rate. All the numbers crunched up? Female employees at IBM in the FAB facility and manufacturing line; it was discovered they were wearing “make up” to work and inside the clean room, which is not allowed. The microscopes showed “make up continuation”
All the proff. The numbers. The stats. The analysis. The result? “IBM cant tell people what to do, and its sexist because women are pressured to look good and many have to wear meak up”
So nothing was done, we couldnt “say” anything and thus, in 1998, IBM closed the line and moved full manufacturing of the MR sliders to Japan (fujisawa). 5K jobs were lost in the end and even then, it was because “IBM was a greedy corporation that hates women / working people” (despite the fact it was more expensive to manufacture in Japan, but IBM wants a zero failure rate, and Japan was delivering the results).
The stats meant nothing and HR and other groups turned it into internally into “IBM doesnt like women”
Tons of examples like this.
Did you know that in Major League Baseball there are no left-handed catchers?
After Jason Sehorn retired from the NFL in 2003, there were no full time white cornerbacks until three of them (Cooper DeJean, Riley Moss, and Ethan Bonner) did it in 2024. If you were an intellectually honest leftist blankslatist, you would be forced to conclude that the color barrier was broken after two decades of institutionalized and systemic racism.
The result? “IBM cant tell people what to do, and its sexist because women are pressured to look good and many have to wear meak up”
So nothing was done
That’s hilarious. Absolutely hilarious.
I like the way you argue here.
Despite that I like and respect him – here
https://www.wmbriggs.com/post/56436/
William M Briggs is Not arguing his case against “IQ” in a coherent way. I couldn’t explain this in a comment, so I tried a different track – but what I really think is better argued in this post of yours.
Alternatively, I think Ian Deary does a good job in the intro to his Intelligence: a very short introduction.
The point is that – at the group level – one can quibble about whatever you want (conceptually or empirically), but it doesn’t make much difference. The common delusion that the whole filed of IQ – Intelligence is some kind of Big Mistake, some kind of reification, or category error – is based on arguments that, if used on other subjects, would eliminate all of science.
Once you’ve accepted the robustness of correlates, intelligence starts getting interesting at That point. I get frustrated by psychometrists who refuse to move-on from their purely-statistical definitions, which is perhaps what WMB is really getting at; but IQ measurements means something both interesting and important.
An excellent point.
All data has errors, so pointing at that data has limitations isn’t much of a criticism. What matters is the nature of the error analysis (or to put it concretely, the size of the error bars).
————————————————————
I actually have a real-life personal professional example that supports your point about eliminating science.
I work with automated systems that perform temperature measurements. When a temperature monitoring system is subject to 50hz/60hz line noise (from AC power), this can show up in Analog-to-Digital conversions. So when one takes multiple measurements, there is going to be amplitude variations caused by the noise. But if you supersample and average, it’s possible to derive a signal that is more precise than the resolution of the Analog-to-Digital converter you are using.
Imagine you had a simplistic 8-bit converter. You could produce values from 0 to 255. In a completely noise-free environment, you would always get the same value (say, 80). But if due to noise the value fluctuated, you could average the readings together to get a much more precise value like 80.35.
In this case, adding noise (error) to the system actually allows you to increase the precision of the final result. This is counter-intuitive, but it is mathematically sound.
People just assume that error itself is bad, but this is not always the case. The error itself often has something to say, or a useful role to play. We don’t throw data away just because it is subject to errors. I’m experiencing that right now in the other thread (re: respondents lying).
If your stance is that it has error so it can’t be useful, you might as well take the stance that Climate Alarmists take and just manufacture the data (which is exactly what they do). Science gets eliminated.
Pingback: Logic, Mysticism, and Metaphysics - Derek L. Ramsey